U.S. Bureau of Labor – PPI Data
The Producer Price Index (PPI) program measures the average change over time in the selling prices received by domestic producers for their output. The prices included in the PPI are from the first commercial transaction for many products and some services. Visit the Bureau of Labor Statistics website here.
Tracking Prices in Printing Ink and the Printing Ink Raw Material Supply Chain
The chart below shows year-on-year (by month) producer price changes for printing inks and the raw materials used to produce printing inks. This data is provided by the U.S Bureau of Labor Statistics – Producer Price Index program. This data is updated on a monthly basis.
Ink and Raw Materials Summary Data: November 2021 – November 2022 (percent change)
| Printing Ink Mfg | 7.01 |
| Synthetic Dye and Pigment Mfg | 21.45 |
| PetroChem Mfg | -13.40 |
| Gen Freight Truck | 10.73 |
| Inorg Chem Mfg | 30.68 |
| Plastics Resins | -8.91 |
| Soybean Oil | 10.88 |
| Carbon Black | 28.31 |
| Organic Chem Mfg | 13.07 |
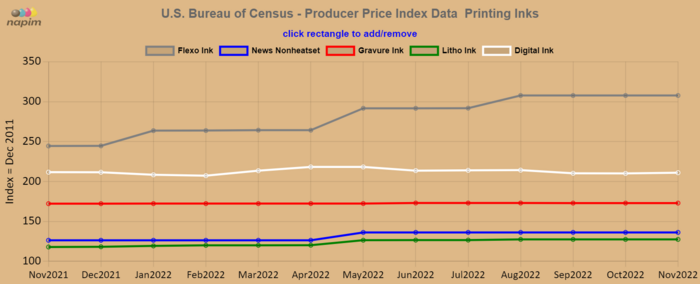
Individual Printing Inks – Producer Price Index Data
The data below covering 5 classes of printing ink (flexographic, lithographic, heat set, gravure digital) is provided by the Federal Reserve Economic Data (FRED) FRED is an online database consisting of hundreds of thousands of economic data time series from scores of national, international, public, and private sources. This data is updated on a monthly basis.
Printing Inks Summary Data: Nov2021 to Nov2022 (percent change)
| Flexographic Ink | 25.86 |
| News Nonheatset | 7.8 |
| Gravure Ink | 0.41 |
| Litho Ink | 8.03 |
| Digital Ink | -0.3 |